- 12 Posts
- 8 Comments


 33·11 months ago
Never felt like 55% though…

 1·11 months ago
I think the ULEZ chat is expectation management from Labour, for if they win by less than they would have hoped to be convincing and to drive a narrative, especially if Selby is a nail biter. But then 1000 seats was expectation management by the tories inthe local elections and look how that went
If you’re interested:
It does depend on how much people just ‘go labour’ because thats the ‘not tory’ vote, and how many look at their constituency and see Lib Dems in second, Labour can’t actually fight everywhere with ground game, and in many places they won’t really want to mand Lib Dems can and will do.
I haven’t played with the tactical voting bit of Electoral Calculus mostly because it is a nationwide value and the regions will differ so much in who they vote if they are voting ‘not tory’. Wales and North go Labour far more just as a baseline, East, South and South-West go Lib Dem more but not in cities, London does Labour, Lib Dem and Green in different ratios depending on borough.
It’s all a bit of a fun nightmare to try that’s also a guess and there’s no public tools (I know of) to try it even if you wanted to, which I kinda do; as any level of tactical voting hammers the Tories even more than these predictions and that’s always fun to see.
Oh I don’t dare underestimate the change in public opinions when it’s election time and suddenly their vote is close and they have to think. I know it happened for Labour in 2017 and a bit in 2019, but it can happen either way.
Don’t get me wrong, Labour could coast into a comfy majority the way things are looking atm.
And those poor Lib Dems, I do think they are being underestimated by the models, but it doesn’t look amazing for them eh.
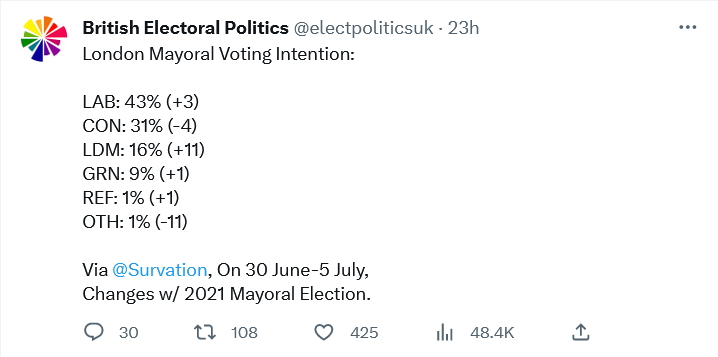
I think whats worse is, looking at and putting in the regional info from their data table, other than the Wales Green party numbers…this one actually feels right, loads of other polls the Scotland numbers have been all over the place, low numbers of people and odd % turning up, but this one doesn’t have anything glaring out at me that’s horrifically and clearly sampling error, even Flavible’s more uniform and conservative model is absolutely brutal at these numbers, and these numbers are what, 1-2% up or down from the average over the last week or so.
This is BEFORE we have an election campaign and Purdah, we know Rishi isn’t the greatest campaigner and he clearly doesn’t like questions, PMQs or being questioned and that all thats going to happen to him for WEEKS during the election.
Dare we start to hope?


 1·1 year ago
Oh nice! Never used any CSS or user.styles stuff before, but that was easy and worked.
Now watch me be too stupid to try an ever change anything about it for myself…
AFAIK that’s one half of the story, but the other is something quite technical and cool in zoology that wasn’t foreseen by ecologists at the time wolves were eradicated.
The wolves being removed caused something called meso-predator release, whereby the coyote numbers in the Yellowstone surged because of the cross over in prey species and lack of competition for that prey. BUT, that meant species not shared with wolves had their numbers heavily reduced by the increase in coyotes, mainly beavers.
When beaver numbers plummeted so did dams along the Yellowstone, and the the water level of the river went down and I think sped up, and that reduced areas for all animals and vegetative growth along the whole river. Reintroducing wolves caused coyote numbers to stabilise back at regular levels, beaver numbers did the same and the river stared to go back normal causing a huge bounce back across the board. Including reducing deer numbers back as coyotes don’t hunt them so they did the opposite of beavers when wolves were removed for the same reason… Meso-predator release but in the opposite direction.