Be aware that the CO2e emissions shown in this app give an indication but have pretty big caveats:
-
The CO2 emissions of nuclear that are shown are most likely too low. Electicity Maps just used the absolute lowest of a number of estimates.
-
The emissions of reservoir-based hydro vary depending on climate and biomass in the reservoir but Electricity Maps uses a single standard value. Some hydro power in warmer climates is connected to methane emissions from the reservoir, because of anaerobic processes at the bottom of the reservoir. Some reservoirs emit as CO2e as a coal plant with a similar capacity. [edited slightly, see below↓]
-
They are showing solar/wind emitting emissions when they’re producing electricity. However, solar and wind don’t work that way because they’re not using consumables. Their emissions mainly come from manufacturing and transport. In essence, solar and wind are emitting just as much whether they are producing electricity or not.
Regarding nuclear to put it into numbers: Current estimates average at about 66g CO₂eq/kWh ranging up to 180. This site uses 5 as estimate!
Thank you for the hydro part, didn’t know that yet. It does not seem as bad as you said tough, This paper states up to 73g CO₂eq/kWh which is far below the 400-800 of a stone coal plant.
My info came from Wikipedia. Your source is from Canada, not Brazil which is exactly the point. :)
The source linked by Wikipedia ist not very sound in this case. It is a website with the sensationalist title “Hydroelectric power’s dirty secret revealed” and in its text the magazine mentions a “a study to be published” without title where it supposedly gets its information from.
You are correct, that in Brazil the biomass may contribute more, in this study from 2002 one of the highest emitting reservoirs is examined. Including everything up to the Ants colonies destroyed by the reservoir. However they note that Emissions decrease significantly after a few years as the biomass is decomposed. Also at the time of the article linked above the plant was still installing turbines, increasing its energy output. This obviously leads to wrong estimations when current carbon emissions to current power output is extrapolated over the lifetime. In 2002 a Cambridge article noted that emissions are on par with fossil fuels (which of course is still not great!) A study in 2016 noted that previous estimates of the emissions may have been quite a bit to high as they collected samples during seasons with high activity.
In summary: We don’t know for certain yet how high the emissions are, but 3.5 times fossil fuel emissions seems to be grossly overestimated.
Thank you for your research! I had indeed not checked the source from Wikipedia. Generally, the point stands but I will check my language on that topic in the future.
Additionally to your points
-the amount of electricity produced by solar pv is significantly underreported. Because a lot of pv is behin the meter and therefore not included.
True. Everything that happens outside of the grid is not counted. That means a lot of rooftop PV generation is not counted but it also means that big companies with private fossil gas plants are not counted either.
-
That UI is beautiful.
Just wanted to say the same… such an unexpected surprise
It must load differently on mobile I guess
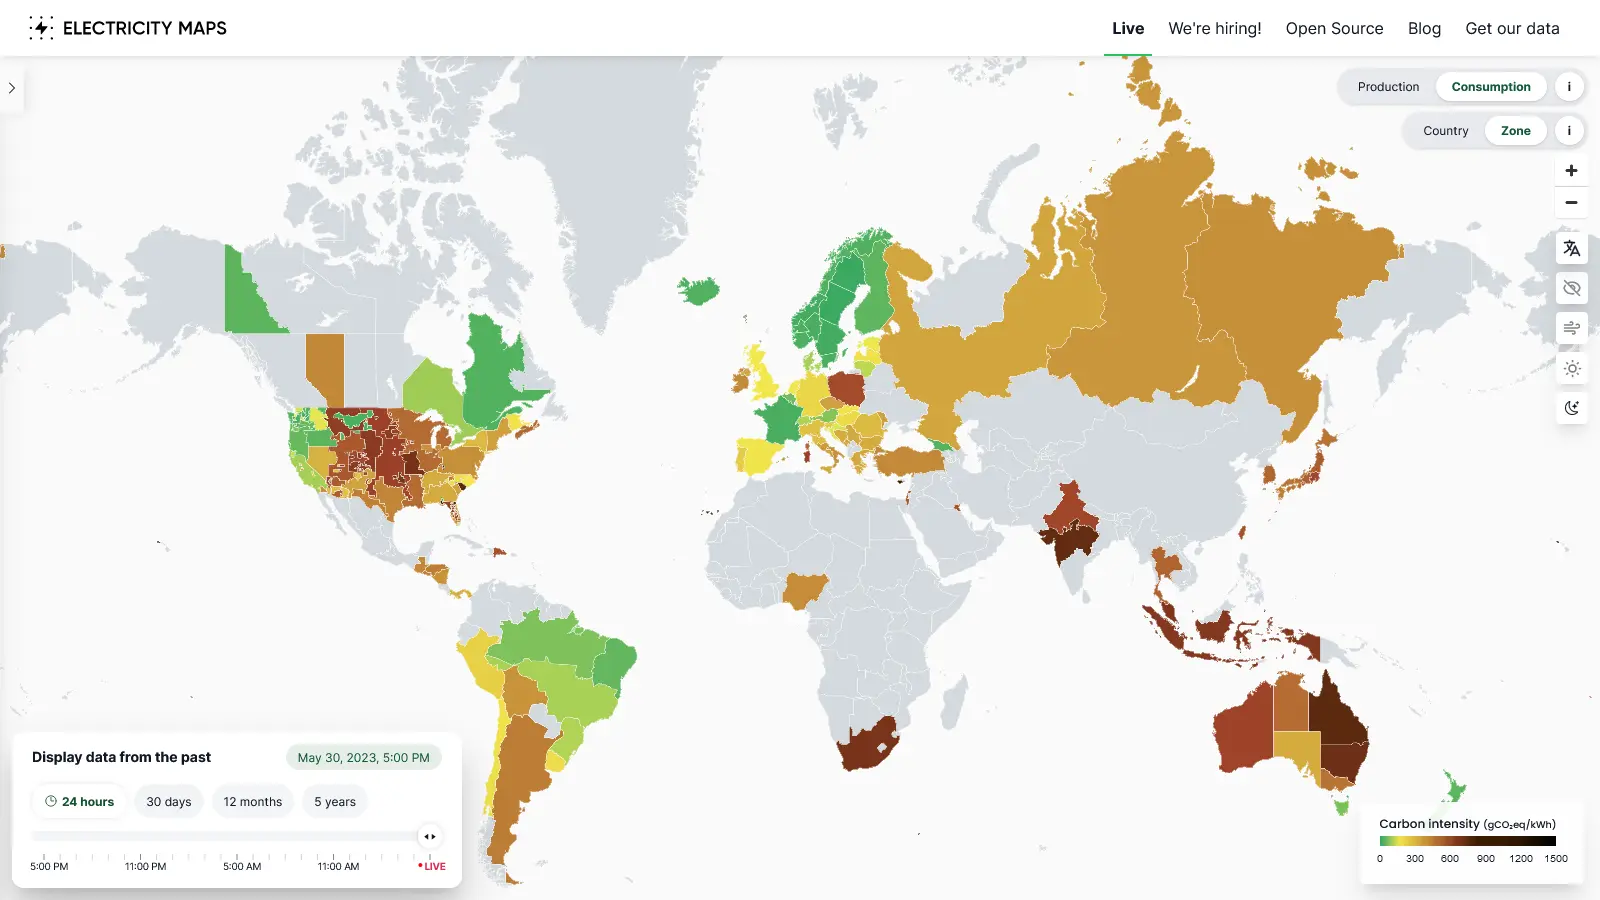
Australia, what you doin’!? So much coal, what the fuck. In a country where you’d expect they have so much space and sun, they could just go solar.
Welcome to our government and their pockets lined with coal money. Not the most ecological government going around. We got a new one recently so hopefully they do atleast a bit more than thr last ones.
Think they have still approved 3 more coal mines, so probably have their pockets lined as well.
A related tool for Germany: https://peakpick.de/webapp/index.php
The idea behind this:
- Electricity generation from wind and solar is not constant. PeakPick visualizes and forecasts the share of renewables.
- By choosing when to run your home appliances, you can use more of the renewable capacity, and less of fossil fuel backups
This made me aware that the best time to use electricity is around noon (+/- a few hours). By shifting your electricity consumption to this time, you can cause less emissions, regardless of your contract.
Open question: A complete picture would require plotting the consumption along the production. For example, while renewables might peak at 1 PM, maybe all that capacity is already eaten up by consumption at that time. If hypothetically consumption was below capacity at 3 PM, it might be better to consume then, even if capacity is lower then.
No data available… Yeah I doubt that
You can help contribute by adding data.
Good point, I might try to do that.
Shouldn’t there be some normalization based on population? Like some of the low population states / siberia have bad emissions but that should have much less effect than a smaller difference in a more populated location.
It’s an electricity map, not am emissions map. Otherwise you would have to also factor in the industrialization of the country and its imports & exports.
You can still normalize based on your totals. Otherwise the coloring is not that useful.
Eg. Western Area Power covers a large part of the US but only produces 5GW.
PJM produces 100GW and covers around the same area including 20GW of coal, 7x that of Western Area.
There should be an option to normalize so you can quickly see where most of the emissions come from.
A good map is simple. This shows one measure very clearly. Adding another dimension would likely make the core purpose harder to interpret.
There is an age old adage “All maps lie” - which is basically another way of saying simplification is key to useful presentation. …aerial photos aren’t very useful for navigation!
South Africa’s data likely doesn’t account for all the diesel burning to avoid worse Loadshedding stages.
Kind of surprised South Carolina is so bad. Just drove by so many solar farms you’d think the state ran it alone. Apparently my random sample was incredibly biased. Also they’re fairly recent installations, so maybe it hasn’t filtered into the data.
- PV isn’t free of emissions
- PV has rather low power density
deleted by creator