

Only when predicting renewable energy adoption would they draw an exponential curve with data and then forecast a near flat-lined linear growth
This is the best summary I could come up with:
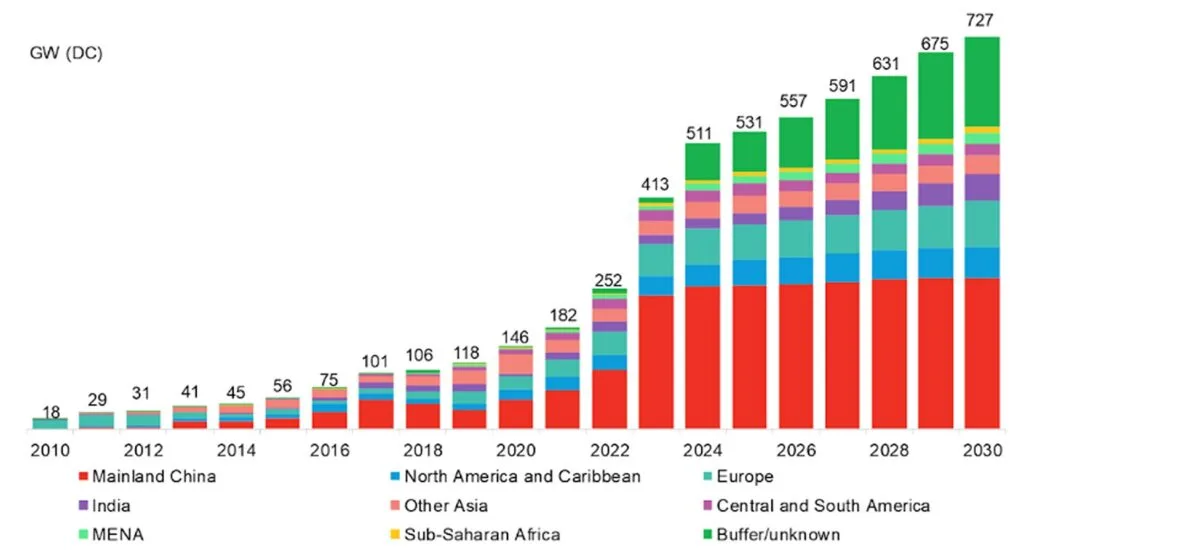
BloombergNEF has released its updated solar market outlook for 2023, projecting that 413 GW of module capacity will be installed this year.
This capacity will mostly be driven by China’s contribution of 240 GW, along with strong growth in many other global regions.
The quarterly update was provided via Bloomberg’s podcast “Switched On” in the episode, “Solar supply glut crushes margins but buildout booming.”
During this two year period, the world will have experienced 125% growth, indicating that a doubling of deployed annual capacity occurred in around one and a half years.
Foremost is China, which has driven the price of solar modules toward $0.10/W.
To continue reading, please visit our pv magazine USA website.
The original article contains 167 words, the summary contains 115 words. Saved 31%. I’m a bot and I’m open source!